Stop guessing which industries to pursue. Labor Market Information is free, it's powerful, and it's exactly what Perkins V expects you to use. Here's a practical field guide to using LMI to choose sharper WBL pathways, recruit the right employers, and document your reasoning in ways that satisfy state and federal accountability requirements.
There's a version of WBL coordination that runs on relationships, gut instinct, and whoever happened to call the school this week. And honestly? It can produce decent placements for a few years. But it doesn't scale, it doesn't survive leadership changes, and it doesn't hold up to a Perkins V audit.
The version that does? It starts with data.
Labor Market Information — LMI — is the aggregate data that describes who's hiring, what they're paying, what skills they want, and where employment is headed in a given region. It's collected by the Bureau of Labor Statistics, the Census Bureau, state workforce agencies, and dozens of regional partners. And most of it is free.
This article is a practical field guide to using LMI to make sharper decisions about which WBL pathways to pursue, how to recruit employers in the right sectors, and how to document your reasoning in ways that satisfy state and federal accountability requirements.
Why Coordinators Avoid LMI (And Why That's a Mistake)
Ask most WBL coordinators how they choose their employer partners, and you'll hear: "We go with whoever's willing." That's not a knock — you're busy, employers are flaky, and a willing partner is a rare and beautiful thing.
But "whoever's willing" creates some predictable problems:
- Program drift: You end up with placements in industries that don't align with your CTE pathways
- Low-wage traps: Students get placed in jobs that exist today but won't in ten years
- Equity gaps: Historically connected industries (healthcare systems, large manufacturers) dominate while emerging sectors go untapped
- Weak Perkins narrative: When your state asks you to justify your programming choices, "that's who called us" is not a defensible answer
LMI doesn't replace relationships — it tells you which relationships to build. That's a meaningful difference.
The LMI Sources That Actually Matter
You don't need a labor economist on staff. You need to know where to look.
Federal Sources
Bureau of Labor Statistics (BLS)
- bls.gov/oes — Occupational Employment and Wage Statistics: median wages, employment levels, and location quotients by MSA and state
- bls.gov/ooh — Occupational Outlook Handbook: 10-year growth projections by occupation, entry-level education requirements, median pay
O*NET Online (onetonline.org)
- Skills, tools, tasks, and education requirements by occupation
- Bright Outlook occupations (high growth, high openings, or emerging)
- Crosswalk from CIP codes (your CTE programs) to SOC codes (occupational categories)
State Sources
Every state with an active workforce development system publishes regional LMI. This is usually housed in the state Department of Labor, the State Workforce Agency, or sometimes the state Department of Education. Look for:
- Statewide and regional occupational projections (short-term: 2 years; long-term: 10 years)
- Job vacancy surveys (what employers are actually trying to hire right now)
- In-demand occupation lists (often tied to Perkins V definitions of high-skill, high-wage, or high-demand)
- Regional wage data disaggregated by industry sector
Coordinator tip: Many states publish a "hot jobs" or "in-demand occupations" list specifically for CTE alignment. Find it. Save it. Use it in every grant narrative you write.
Regional Sources
American Community Survey (ACS) via Census.gov or data.census.gov
- Commuting patterns, educational attainment, income levels by census tract — critical for equity analysis
Regional Workforce Development Boards (WDBs)
- Under WIOA, every region has a Workforce Development Board that publishes sector analyses and in-demand occupation lists. They want to partner with CTE programs. Call them.
QCEW (Quarterly Census of Employment and Wages)
- Establishment-level data on which industries have the most employers in your county — great for identifying who to cold-call for employer recruitment
Step-by-Step: Doing an LMI Analysis for Your Program
This doesn't have to be a research project. Block two hours, and work through this process.
Step 1: List Your Current CTE Pathways
Start with what you have. List every active CTE pathway by name and CIP code. If you don't know your CIP codes, your state CTE director or your district's Perkins coordinator has them.
| Pathway | CIP Code |
|---|---|
| Health Science / Nursing Assistant | 51.3902 |
| IT / Cybersecurity | 11.1003 |
| Construction Trades | 46.0201 |
| Early Childhood Education | 13.1209 |
Step 2: Map CIP Codes to SOC Codes
Use O*NET's CIP-to-SOC crosswalk (onetonline.org/crosswalk) to find the occupational categories your pathways lead to. This gives you the codes you need to pull wage and demand data from BLS and state sources.
Step 3: Pull Demand Data for Each SOC
For each occupation:
- 10-year projected growth (from BLS OOH or your state projections)
- Annual job openings (not just growth — replacement openings matter too)
- Median wage in your region (from BLS OES at the MSA level)
- Entry-level wage if available
Organize this in a simple spreadsheet. You're building a prioritization matrix.
Step 4: Check Your State's In-Demand List
Cross-reference your occupations against your state's official in-demand or high-skill/high-wage/high-demand (HS/HW/HD) list. Why? Because:
- Perkins V requires you to offer programs in occupations that meet the HS/HW/HD threshold (or justify exceptions)
- Many states fund WBL stipends or incentives for placements in in-demand sectors
- Your Perkins local plan narrative must explain how your WBL placements connect to regional labor market needs
If an occupation isn't on the in-demand list, that doesn't automatically kill the pathway — but you need a documented rationale. "Students in this rural community have no other pathway to this sector" is a defensible answer. "We've always done it" is not.
Step 5: Identify Gaps and Opportunities
Look at the data and ask:
- Where is employer demand high but your placements are thin? That's a recruitment target.
- Where are your placements concentrated in low-growth or low-wage work? That's a diversification problem.
- What sectors are growing in your region that you don't serve at all? That's a program development conversation.
Using LMI for Employer Recruitment
LMI doesn't just justify your existing placements — it tells you who to call.
Sector-Focused Outreach
Instead of generic "we need employers" appeals, use QCEW or your state's employer database to identify the top employers by NAICS code in your county or region. Then do targeted outreach by sector:
- Healthcare (NAICS 62): Hospitals, long-term care facilities, dental offices, veterinary clinics
- Construction (NAICS 23): General contractors, specialty trades, real estate developers
- IT/Professional Services (NAICS 54): MSPs, cybersecurity firms, IT staffing agencies
This approach also helps with Perkins equity targets: if LMI shows that a high-growth sector in your region is underrepresented in your WBL placements for specific student populations, you have both a recruitment priority and a documented equity rationale.
Talking to Employers in Their Language
When you call an employer for the first time, referencing LMI gives you instant credibility:
"We're building out our healthcare WBL pipeline because BLS projects a 13% growth in medical assistant jobs over the next decade, and we want to make sure our students are ready. Are you facing hiring challenges in that area?"
Most employers will say yes. Then you have a conversation.
Connecting LMI to Perkins V Accountability
Perkins V (the Strengthening Career and Technical Education for the 21st Century Act) places significant emphasis on using LMI to make program decisions. Specifically:
Section 134 (Local Application) requires local eligible recipients to describe how their CTE programs are aligned with regional or local economic priorities. LMI is your evidence base for that description.
Perkins Performance Indicators include:
- 2P1: Placement in postsecondary education, military, or employment
- 2P2: Placement in non-traditional fields
LMI analysis helps you design WBL pathways that move the needle on both of these — by targeting high-placement-rate sectors and deliberately recruiting in non-traditional fields where LMI shows growing demand.
State LMI Requirements: Many states have added LMI-alignment requirements to their local Perkins plans. If yours has, make sure you can point to the specific data sources you used and document them in your program of study review process.
WBL Tracker note: If you're using a platform to track WBL placements, make sure your placement data is organized by industry sector (NAICS or SOC code). That alignment allows you to run a simple report at grant time that shows exactly how your placements map to in-demand occupations — a five-minute pull that used to take a day of manual work.
Building an LMI Snapshot for Your Region
One of the most useful things you can create as a WBL coordinator is a one-page regional LMI snapshot that you update annually. It should include:
- Top 10 in-demand occupations in your region (with projected growth and median wage)
- Top 5 growing sectors by employment
- Your current WBL placement distribution by sector
- Gap analysis: Where do demand and placements diverge?
- Data sources and date of last update
This document becomes the backbone of your Perkins narrative, your advisory committee presentations, your program of study reviews, and your employer recruitment pitch deck. It's 2-3 hours to create and saves you dozens of hours of scrambling later.
Common Mistakes Coordinators Make with LMI
Using national data when regional data exists. National projections can be wildly off from local reality. A sector declining nationally can be booming in your metro. Always layer in state and regional data.
Treating projections as guarantees. LMI shows trends, not certainties. The pandemic scrambled a decade of projections in eighteen months. Use LMI as a directional tool, not a crystal ball.
Ignoring replacement openings. Even occupations with flat or slightly negative growth can have high annual openings because of retirements and turnover. Skilled trades are a classic example — welding employment isn't growing fast, but there are thousands of job openings every year.
Not updating data. LMI changes. The BLS OES updates annually. State projections update every 2 years. Build a calendar reminder to review your LMI snapshot each spring before you write your Perkins local plan.
A Word on Rural Districts
If you coordinate WBL in a rural district, you know that MSA-level data often doesn't describe your labor market. The nearest MSA might be two hours away.
For rural programs:
- Use county-level QCEW data rather than MSA data
- Work with your regional Workforce Development Board — they often have custom LMI analyses for rural regions
- Look at drive-time isochrones: Where can your students realistically commute for a WBL placement? That's your true labor market
- Partner with USDA Rural Development — they fund workforce analyses in rural areas that can provide granular LMI you won't find anywhere else
Conclusion: Data-Driven WBL Is Defensible WBL
Every placement decision you make has an implicit rationale. LMI makes that rationale explicit — and when it's explicit, it's defensible. Defensible to your principal. Defensible to your state CTE director. Defensible in your Perkins local plan.
More importantly, LMI-aligned WBL pathways put students in front of employers who are actually hiring, in occupations that actually pay, in sectors that are actually growing. That's the job.
The tools are free. The data is there. The only thing standing between your program and a truly strategic WBL pipeline is two hours and a spreadsheet.
Next steps for this week:
- Bookmark bls.gov/ooh and your state's LMI portal
- Pull the CIP-to-SOC crosswalk for your top two CTE pathways
- Check whether your occupations appear on your state's in-demand list
- Schedule a call with your regional Workforce Development Board

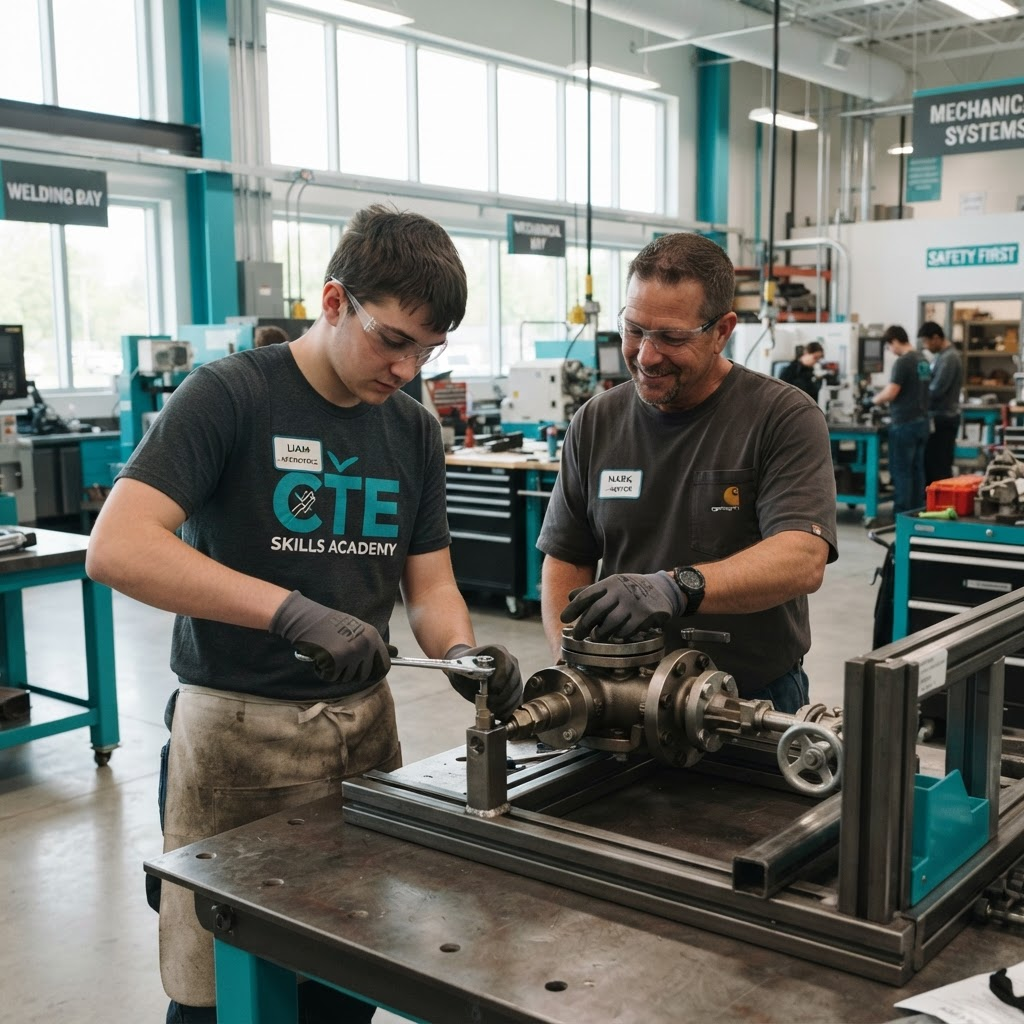
Students collaborating in a work-based learning environment
About the Author
WBL Tracker Team
Work-Based Learning Specialists
The WBL Tracker team consists of former educators and coordinators who understand the challenges of managing work-based learning programs. We're dedicated to helping schools save time and improve student outcomes.
Ready to Transform Your WBL Program?
Join coordinators who are saving 10+ hours per week with automated tracking and compliance reporting.